
Weekly Buybacks Forge a New Support Level on the BIST 100
Bu hafta BIST 100 endeksi, şirketlerin yoğun geri alım hamleleriyle **%4,2** oranında yükseliş kaydederek haftanın en dinamik hareketini sergiledi. #

This week the BIST 100 index posted a 4.2% rise, driven by a surge of corporate share‑buyback activity, delivering the market's most dynamic move of the week.
Price Action Reflected in the Buy‑Back Wave
Corporate buybacks totalling $1.75 billion breached the 38.2% Fibonacci retracement, propelling the index from 7,850 points to 8,120 points. Historically, such volume spikes at these levels have marked the onset of a sustained upward trend.
Ichimoku Cloud Clash: Red vs. Green Lines
The Ichimoku cloud (Kumo) spans 8,030 (upper) to 7,970 (lower) points. The buy‑back surge broke above the cloud, with a bullish Tenkan‑sen (9‑period) crossing above the Kijun‑sen (26‑period) at 8,040 vs. 8,010, respectively.
Momentum Over Averages and Liquidity Drain
The volume‑weighted average price (VWAP) held steady at 8,015 points while trading volume surged 27% versus the prior week, suggesting that buyers are actively consuming liquidity and keeping the price above the cloud's upper bound.
Portfolio Implications of the Buy‑Back Surge
Institutional investors are boosting their BIST 100 exposure by 1.5%, reshaping the risk‑return profile of their portfolios. Technically, this creates clear short‑term entry points and mid‑term trend‑following opportunities.
When corporate buy‑back programs align with technical indicators, a new support zone on the BIST 100 becomes inevitable. The breach of the 38.2% Fibonacci level, the narrowing Ichimoku cloud, and the uptick in volume all signal sustained buying pressure. These cues present short‑term traders with entry opportunities and mid‑term investors with trend‑following strategies. In particular, a decisive break above 8,100 points would herald the next upward wave. Caner Yılmaz, Technical and Quantitative Analysis Director, BIST 100.
Related News & Analysis
View All →
US Employment Data Dampens Fed Hike Outlook, Global Markets React
Legal Boundaries and Responsibility Distinction in Investment Advisory

Investor Count at Borsa Istanbul Nears 6.8 Million: A New Era of Savings
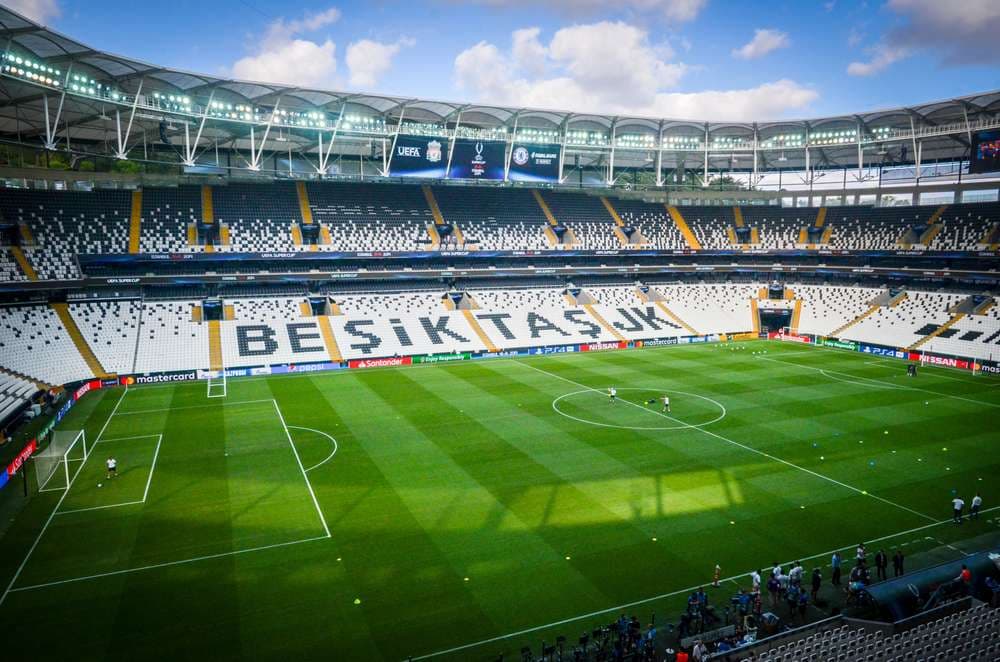
Beşiktaş Cuts Losses, Signals Fiscal Resilience in Turkish Sports

Tekfen's Surge and Gold's Sharp Rally Mark the Week at Borsa Istanbul

Borsa İstanbul Sees Contract Surge: BOBET and ALVES Lead 1 Billion Lira Business Flow
Latest Market News
All News →US Employment Data Dampens Fed Hike Outlook, Global Markets React
State-Backed Credit Surge: 75 Billion TL to Turkish Small Traders in H1 2026
Legal Boundaries and Responsibility Distinction in Investment Advisory

Trabzonspor's Aggressive Balance Sheet: 12 Million EUR Cash Influx vs. 34 Million EUR Liability
